Knowing the melting point of a substance is important. Being able to graph the changes is also important.
You are given 3 different Metals with no names. All you know is one is titanium, one is iron and one is steel.
You know that steel’s melting point is 1370 degrees, iron’s is 1538 degrees and titanium’s is 1668 degrees.
To identify which metal is which, you could bring them to melting point and record the data.
We can also test the purity of something by melting it and recoding the data.
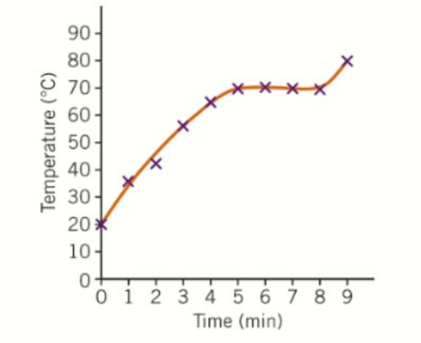
Observe the graph to the left. At 20 deg Stearic acid is a solid. As we increase the heat, the stearic acid begins to heat up. At 70 Deg it’s a liquid (Notice how the graph plateaus and then continues).
It stays at 70 deg until it has all melted, once completely melted it continues to heat up.
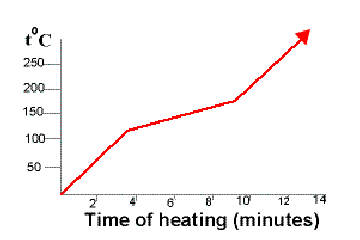
Mixtures don’t have sharp melting points. This means their graph would gradually increase through out, with no plateau.
The graph to the right shows how chocolate melts. Chocolate is a mixture between various proteins, sugars and fats.
Questions
1. Explain what a substance is
2. Explain what a mixture is and give 2 examples.
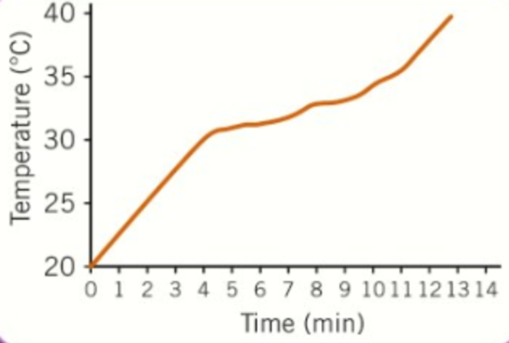
3. Observe the graph bellow. It represents butter. Based on the graph, state and explain wether butter is a substance or mixture.
4. Using the Kinetic particle theory, explain what is happening as a substance changes from a solid to a liquid to a gas.
5. What is the process called, when a liquid becomes a solid
6. What is the difference between melting and boiling point
7. Substance A, has a melting point of -10 degrees. Jack thinks substance A will be a liquid at 20 degrees, while Tim thinks it could be a liquid or gas. Who do you think is right and why?
8. Substance B is a special substance. Every 20 degree it changes state. At -20 degrees it is a liquid. At -40 degrees it is a ________________ and 0 degrees it is a _________.
Boiling point is different from melting point.
You can measure the boiling point of a substance by pouring the liquid into a beaker Heating the liquid and measuring the temperature every minute.
If you were to plot the results, you get something similar to the graph to the right. Notice how the graph plateaus. This means the boiling point is 100 degrees.
By know the melting point and boiling point of a substance, you can predict the different states the substance will be in at different temperatures.
For example, at room temperature (20 deg) silver is solid. Its melting point is 961 degrees, meaning it becomes a liquid. It boiling point is 2210 deg. This means silver is a liquid from 961 to 2210. Above 2210 silver becomes a gas.
Questions
1. Substance A, is a solid at -10 degrees, its melting point is 200 degrees and its boiling point is 220 degrees. What temperatures is it a solid, liquid and gas?
2. Tom was curious to see the melting and boiling point of substance B. Placed it in a pot and began heating it up. He recorded the temperature of the substance every minute and obtain the following results
A. Graph the following results in a lie graph.
B. State what the melting point and boiling point is of substance B